ACR Unleashed – Integrate ACR And Azure Monitor
The third part of Azure Container Registry Unleashed will guide you through the process of integrating ACR and Azure Monitor to collect essential information and metrics about your ACR instances at runtime. The integration of ACR and Azure Monitor is currently in public preview. However, retrieving insights about your ACR instance is mission-critical, so we will dive into this topic now.
- What Is Azure Monitor
- Create A Log Analytics Workspace
- Connect ACR To Azure Monitor
- Populate Sample Data Into Azure Monitor
- Query ACR Events And Metrics Using Azure Monitor
- Create Alerts For ACR Events
- The ACR Unleashed series
- Conclusion
What Is Azure Monitor🔗
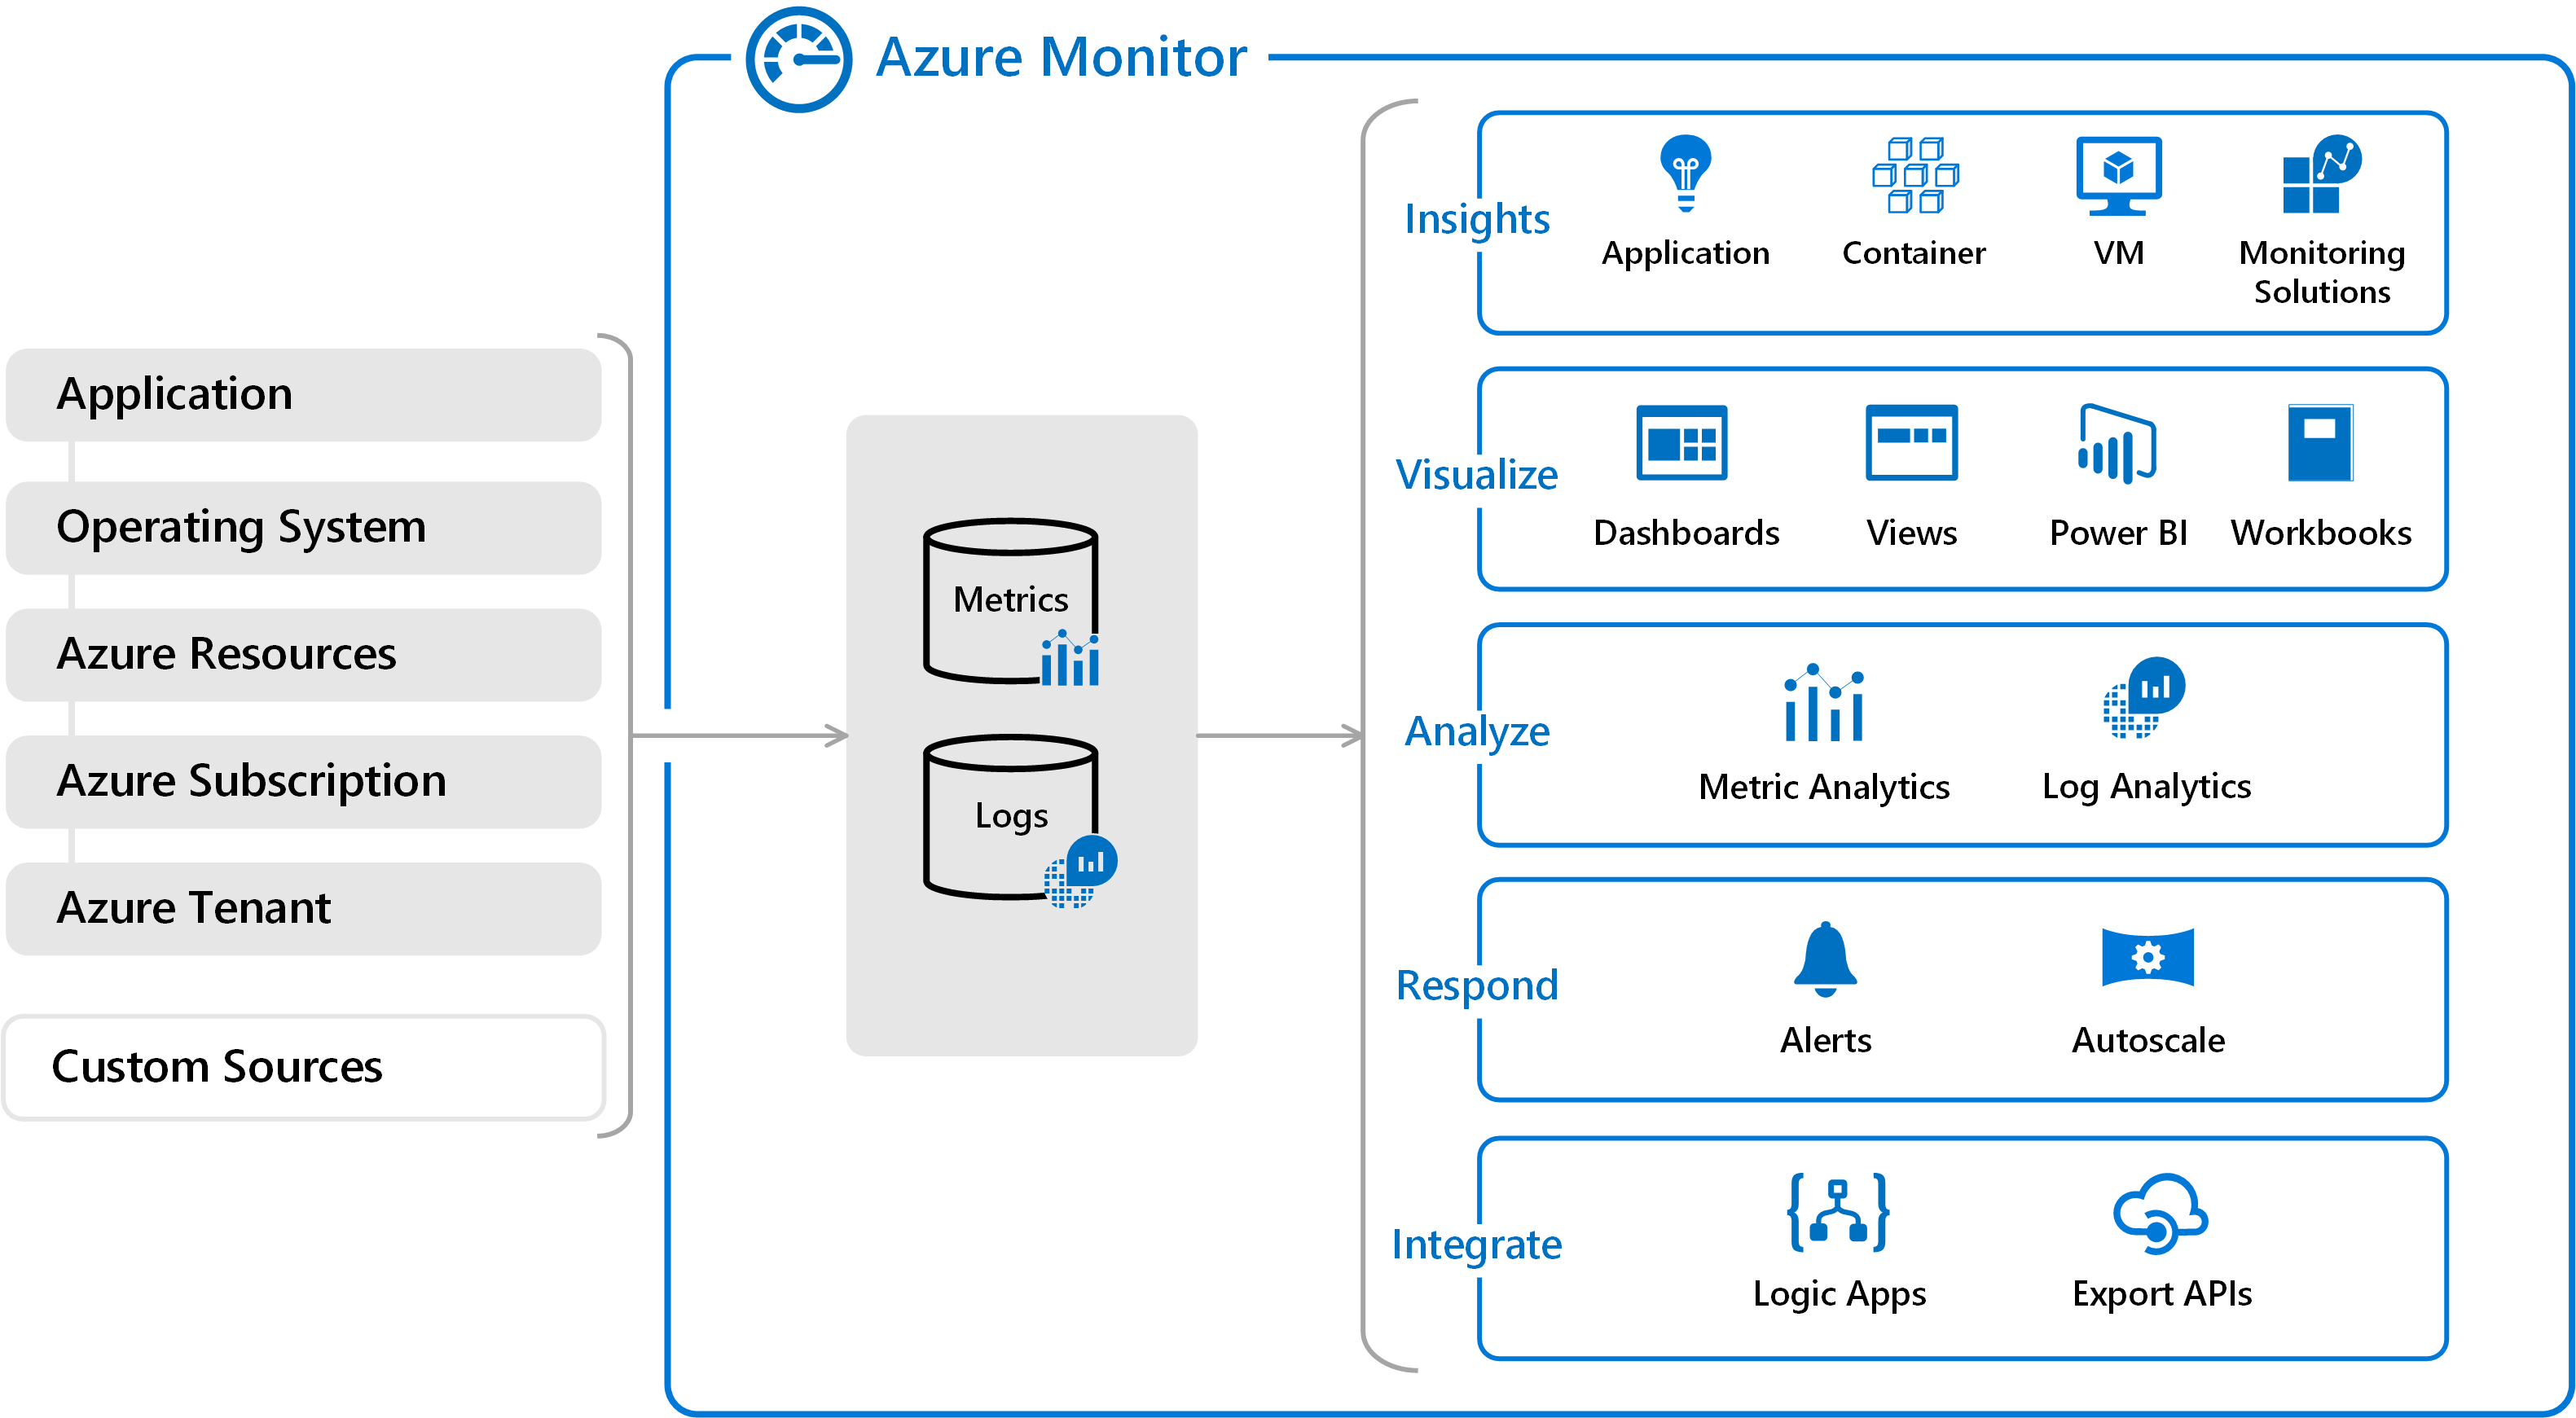
Azure Monitor is a centralized hub for aggregating, analyzing, visualizing and working with data. It consumes data from different sources and collects that data in data stores. All data collected by Azure Monitor fits into on of two categories, logs and metrics.

As you can see on the left side of the diagram, Azure Monitor collects logs and metrics from different layers like Application, Azure Resource, Azure Subscription, Custom Resources and some others. Azure Container Registry provides logs and metrics and fits into the “Azure Resource” category. If we – conceptionally – zoom in a bit, we can see how data (again metrics and logs) flow from ACR into Azure Monitor:

To ship data from ACR to Azure Monitor, we have to utilize an Azure Log Analytics workspace. Although chances are good that your subscription already contains a Log Analytics Workspace, we are going create a new instance to isolate our ACR related data. If you want to dive deeper into concepts and features offered by Azure monitor, consult the official product documentation.
Create A Log Analytics Workspace🔗
You can quickly create a new Azure Log Analytics Workspace using Azure CLI. We will create the new Azure Log Analytics Workspace in Azure Resource Group “acr-unleashed” to group it logically with our ACR instance.
az monitor log-analytics create -g acr-unleashed \
 --name acr-unleashed-ws
Provisioning a new workspace can take a couple of seconds, wait for the command to finish. Alternatively, you can examine your currently selected subscription and list all available Azure Log Analytics Workspaces using the az monitor log-analytics workspace list command.
Connect ACR To Azure Monitor🔗
You integrate ACR with Azure Monitor by adding a corresponding diagnostic-settings to the ACR instance. Although this could be done via Azure Portal, we will use Azure CLI.
$workspaceid=$(az monitor log-analytics show -n acr-unleashed-ws \
  -g acr-unleashed -o tsv --query id)

$acrid=$(az acr show -n unleashed -o tsv --query id)

az monitor diagnostic-settings create --resource $acrid \
  -n "ACR Diagnostics" \
  --workspace $workspaceid \
  --logs '[
    {
      "category": "ContainerRegistryRepositoryEvents",
      "enabled": true,
      "retentionPolicy": {
        "days": 0,
        "enabled": false
      }
    },
    {
      "category": "ContainerRegistryLoginEvents",
      "enabled": true,
      "retentionPolicy": {
        "days": 0,
        "enabled": false
      }
    }
  ]' \
  --metrics '[
    {
      "category": "AllMetrics",
      "enabled": true,
      "retentionPolicy": {
        "days": 0,
        "enabled": false
      },
      "timeGrain": null
    }
  ]'
The snippet configures diagnostic-settings for all events and metrics currently available as part of the preview. Chances are good that we will see more and more log types in the near future.
Populate Sample Data Into Azure Monitor🔗
Once ACR is connected to Azure Monitor, it could take a couple of minutes until first logs and metrics show up in Azure Monitor. To populate some data, we will feed some Docker Images into the ACR instance. The following script will create a simple Docker Image and publish it in ACR using different tags.
#!/bin/bash

mkdir azmonitor
cd azmonitor
echo 'FROM nginx:alpine' > Dockerfile

docker build . -t unleashed.azurecr.io/azmonitor:latest

tags=( 1 2 3 4 5 6 7 8 9 10 )
for i in "${tags[@]}"
do
  tag=unleashed.azurecr.io/azmonitor:${i}
  docker tag unleashed.azurecr.io/azmonitor:latest ${tag}
  docker push ${tag}
  echo "pushed ${tag}"
done
Store the content of the snippet above to a local file (I called mine feed-acr.sh). Change the file mode bits to allow script execution via chmod +x feed-acr.sh and run the script via ./feed-acr.sh.
Query ACR Events And Metrics Using Azure Monitor🔗
Having some data in Azure Monitor, you can move over to Azure Portal and examine the collected data. First let’s look at the ACR Logs. In Preview, ACR logs just two kinds of events.
- ACR Authentication Events
- ACR Repository Events (Push only)
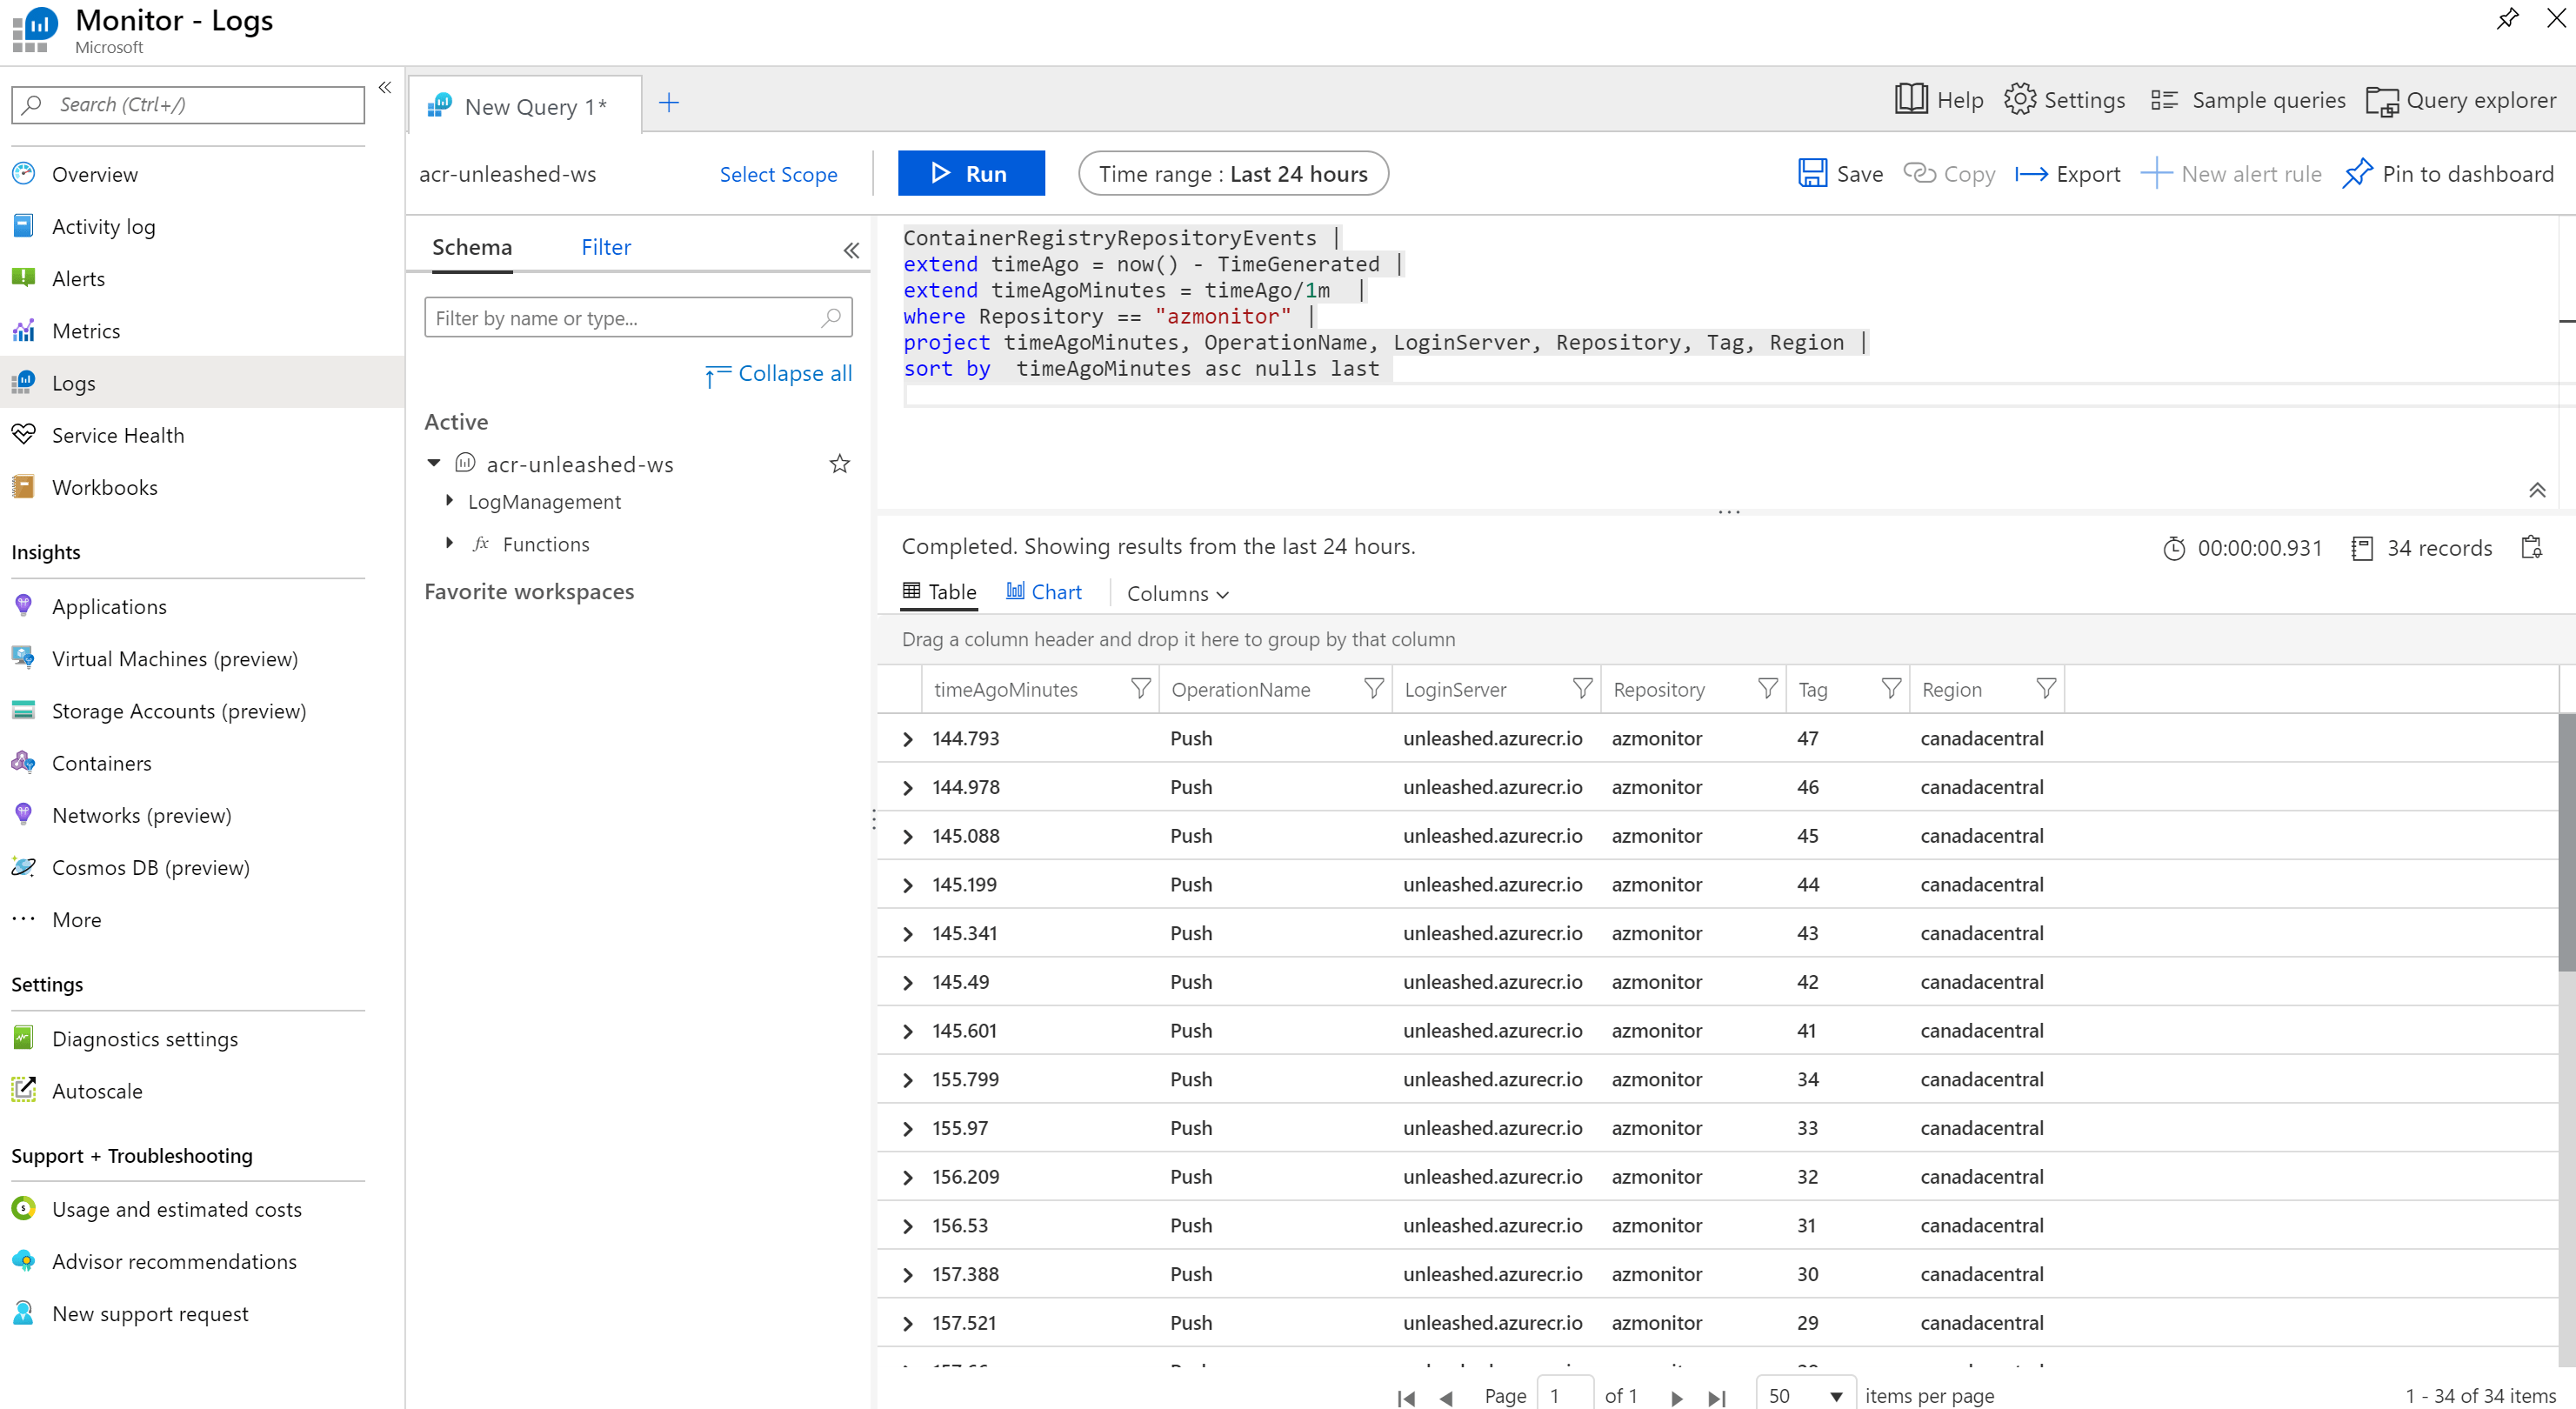
Navigate to Azure Monitor and open LOGS. In LOGS, click scope and select our Log Analytics Workspace. You can query Azure Monitor with Kusto Query Language, which is easy to learn if you already know things like LINQ or TSQL. Provide the following query and see Azure Monitor displaying the results
ContainerRegistryRepositoryEvents |
extend timeAgo = now() - TimeGenerated |
extend timeAgoMinutes = timeAgo/1m  |
where Repository == "azmonitor" |
project timeAgoMinutes, OperationName, LoginServer, Repository, Tag, Region |
sort by  timeAgoMinutes asc nulls last

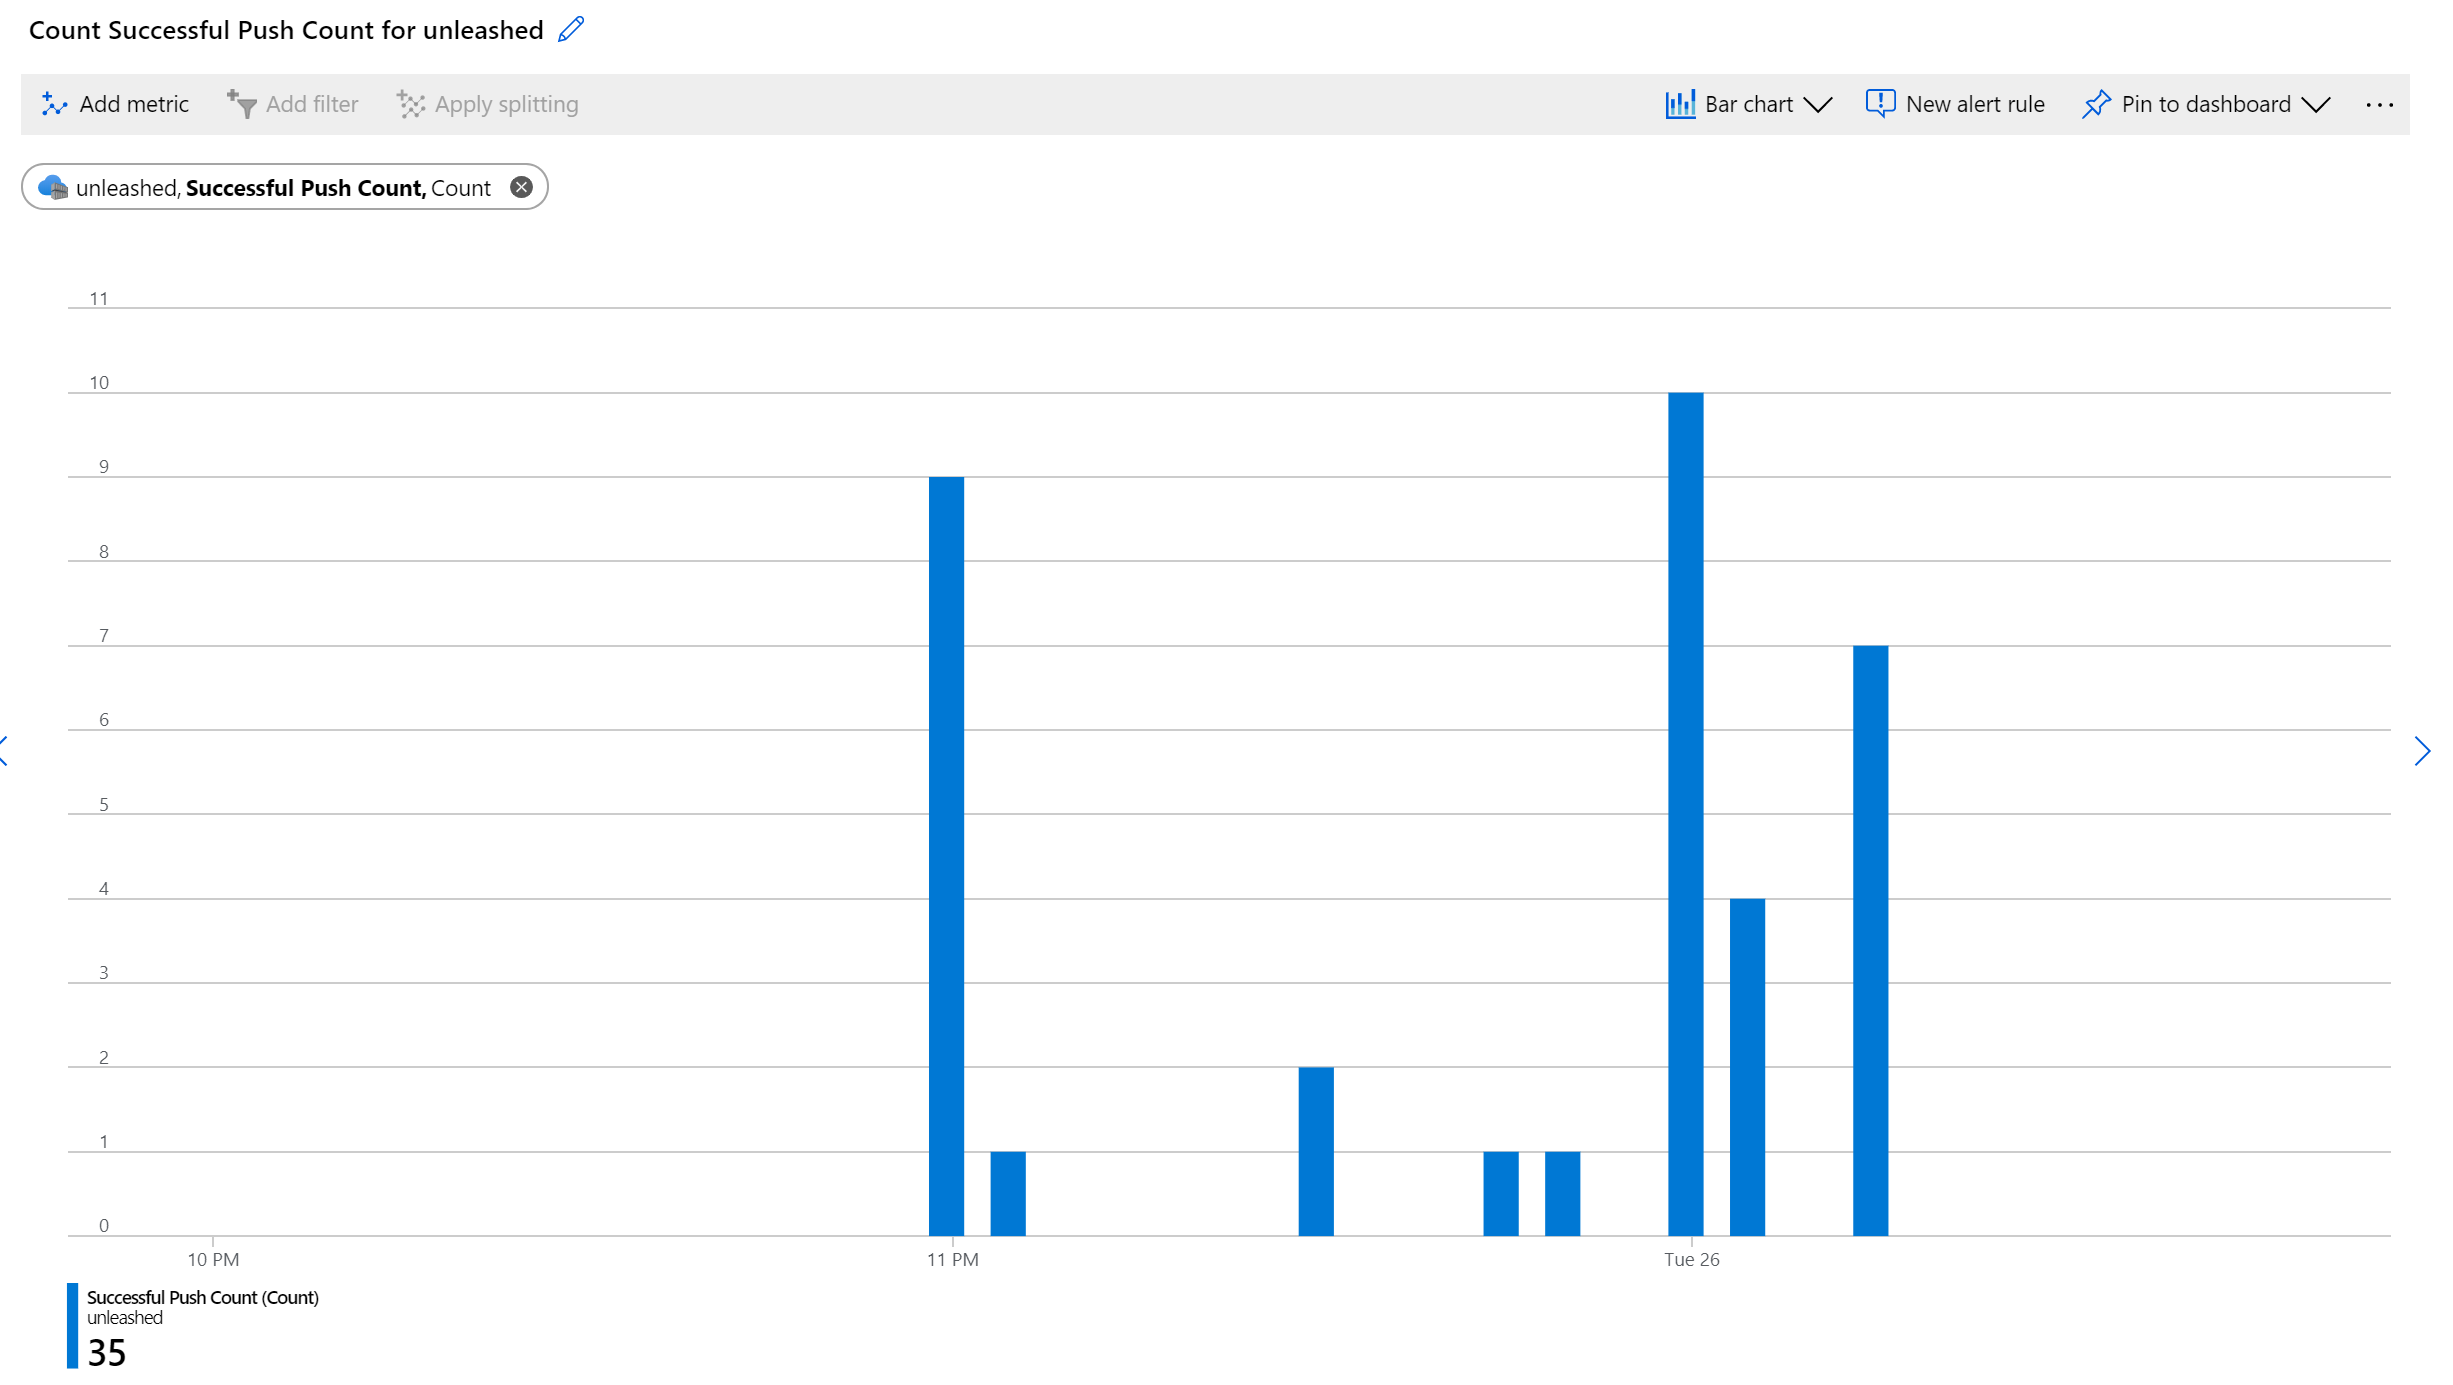
To examine the ACR Mertics, open the Metrics blade in Azure Monitor and add the metrics you are interested in. For example you can visualize the total metrics of successful Push operations

Create Alerts For ACR Events🔗
Last but not least, we are going to instruct Azure Monitor to send notifications via text and mail if our ACR instance inspects higher load as expected. For demonstration purpose, we define a unexpected, high load when more than five images or tags were successfully pushed within the timeframe of five minutes.
In Azure Monitor we use Action Groups to group notifications logically, customize the corresponding command to send text to your phone number and mail to your email address. Once we’ve created an Action Group a custom alert will create a custom alert definition.
$email=[email protected]
$phonecountrycode=1
$phoneno="555 555 555"

$acrid=$(az acr show -n unleashed -o tsv --query id)

$groupid=$(az monitor action-group create -n acr-peek -g acr-unleashed \
  --short-name acr-peek \
  --action email mail-for-me $email \
  --action sms sms-for-me $phonecountrycode $phoneno \
  -o tsv --query id)

az monitor metrics alert create -n acr-peek -g acr-unleashed  \
  --scopes $acrid \
  --condition "total SuccessfulPushCount >= 5" \
  --window-size 5m \
  --evaluation-frequency 1m \
  --action $groupid \
  --description "ACR Peek Alert"
The following shell script will create and push seven new tags to ACR.
#!/bin/bash

tags=( 11 12 13 14 15 16 17 18 19 20 )
for i in "${tags[@]}"
do
  tag=unleashed.azurecr.io/azmonitor:${i}
  docker tag unleashed.azurecr.io/azmonitor:latest ${tag}
  docker push ${tag}
  echo "pushed ${tag}"
done
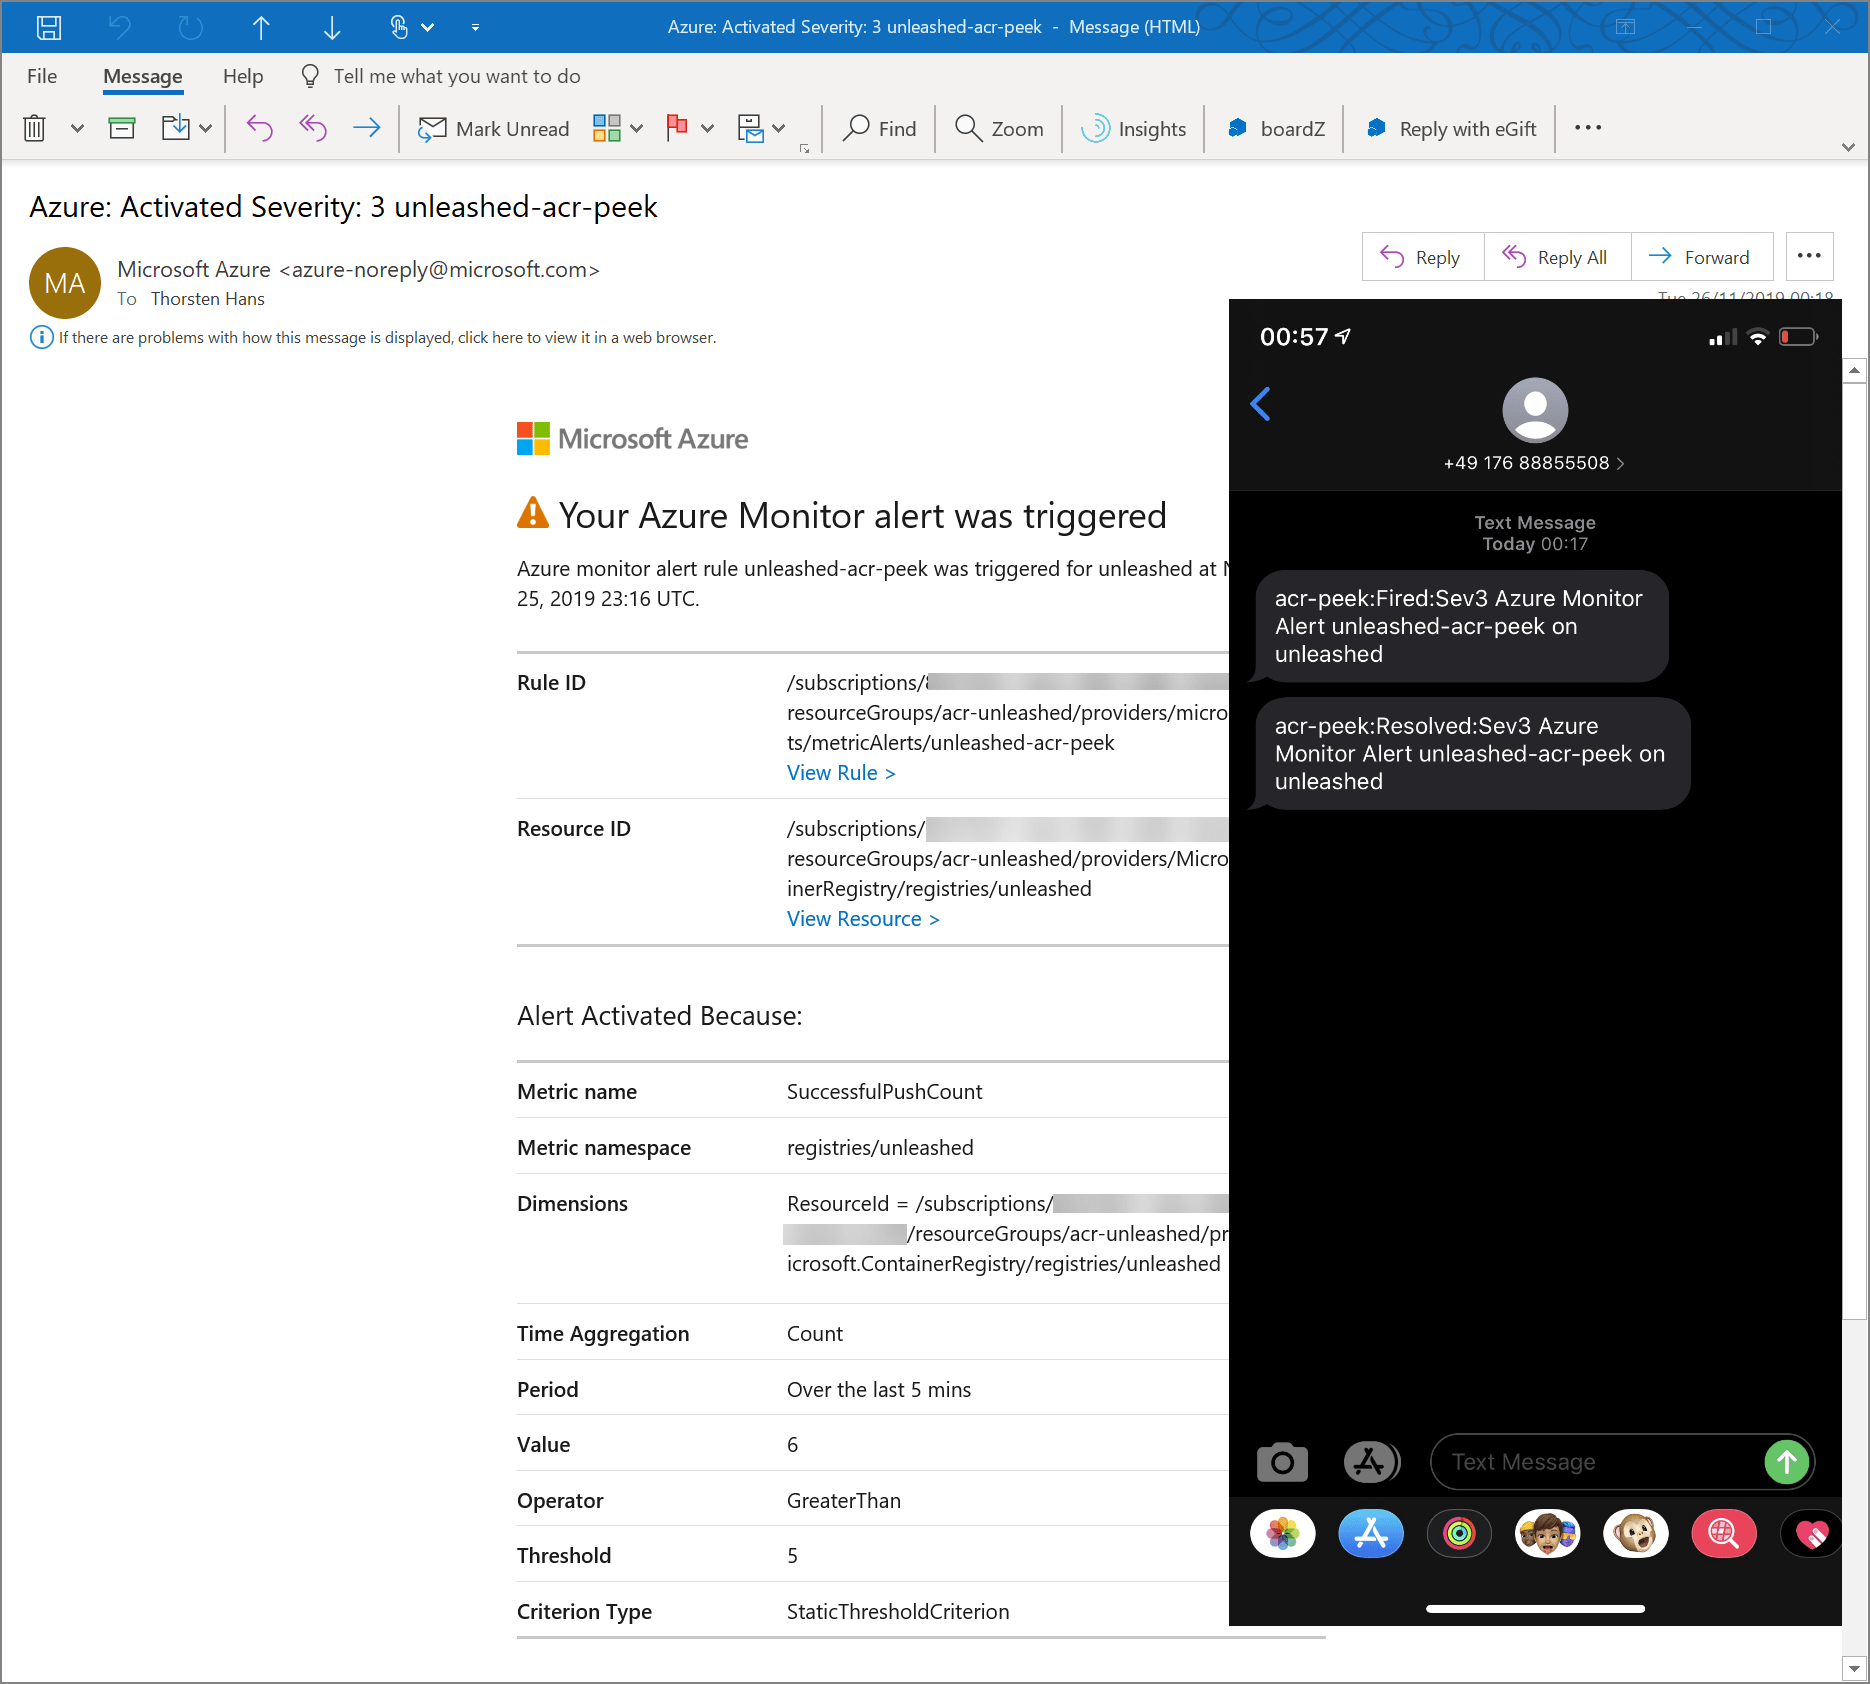
Some seconds after all images have been pushed to ACR, you will receive both, a text and a mail mentioning an unexpected load happening on Azure Container Registry.

The ACR Unleashed series🔗
- Part 1 - Introduction and Geo Replication
- Part 2 - Authentication, IAM and Content Trust
- 👉🏻 Part 3 - Integrate ACR and Azure Monitor
- Part 4 - Webhooks
- Part 5 - Tasks
- Part 6 - Image scanning with Azure Security Center
- Part 7 - Use ACR as Registry for Helm charts
Conclusion🔗
Integrating ACR and Azure Monitor is straight forward and pretty much self-explaining. To monitor and operate your private Docker Registry professionally, you should enable Azure Monitor integration immediately for all your critical ACR instances. We will look into ACR Webhooks in the next part of the Azure Container Registry Unleashed series.
You can subscribe to my blog newsletter and get automatically notified once the next article has been published. That’s the best way to stay current and never miss an article.