Integrate Virtual Machine Scale Sets with Azure Monitor and VMInsights using Terraform
Cloud-Native does not mean “containers only”. Many organizations are still adopting cloud computing and trying to move their workloads into the cloud.
Recently, I helped a customer to bring long-running, compute-intensive workloads to Azure. The particular workload must run on Windows. Although most parts of the overall application are stateless, containerized, or even serverless, this component was special. We decided to leverage Azure Virtual Machine Scale Set (VMSS) to host that component.
The actual infrastructure consists of many services loosely coupled together using services like Azure Service Bus and others. However, for the scope of this article, we’ll focus on VMSS, its extensions, and the Log Analytics stuff.
So, this post walks you through all necessary resources and their configuration to provision a new VMSS, including Log Analytics Agent (MMA), Dependency Agent (DA), and VMInsights using Terraform.
The Terraform project🔗
The project has been created using Terraform version 1.0.5 and AzureRM Provider version 2.75.0. On top of that, no further technical requirements are necessary on your local machine.
Terraform can use different authentication mechanisms to interface with Azure’s REST API. My advice is to use a dedicated Service Principal (SP) for authentication. Consult the AzureRM Provider documentation to learn more about authentication. The samples below use quite some variables. The most important ones are quickly explained here:
rg_name: Name of the Azure Resource Grouplocation: Desired Azure Regionvmss_*: Different variables in the scope of VMSSaddress_space_*: Address spaces used for virtual network infrastructure
Virtual Network Infrastructure🔗
First, you need an Azure Virtual Network (vNet) with a subnet. We will deploy the VMSS to the subnet during the article.
# vnet.tf
resource "azurerm_virtual_network" "vnet" {
  resource_group_name = var.rg_name
  location            = var.location
  name                = "vnet-vmss-sample"

  address_space       = [var.address_space_vnet]
}

resource "azurerm_subnet" "internal" {
  resource_group_name  = var.rg_name
  virtual_network_name = azurerm_virtual_network.vnet.name
  name                 = "sn-internal"

  address_prefixes     = [var.address_space_vmss_subnet]
}
NAT Gateway for outbound traffic from VMSS
The VMSS machine instances require outbound internet connectivity to send telemetry data to Azure Monitor. Although there are different approaches to achieve that, I decided to use a NAT Gateway based on this official comparison.
# nat-gateway.tf

resource "azurerm_public_ip" "pip_outbound" {
  resource_group_name = var.rg_name
  location = var.location
  name = "pip-vmss-outbound"

  allocation_method = "Static"
  sku = "Standard"
}

resource "azurerm_nat_gateway" "nat_vmms_outbound" {
  resource_group_name = var.rg_name
  location = var.location
  name = "nat-vmss-outbound"

  idle_timeout_in_minutes = 15
  sku_name = "Standard"
}

resource "azurerm_nat_gateway_public_ip_association" "nat_pip" {
  nat_gateway_id = azurerm_nat_gateway.nat_vmms_outbound.id
  public_ip_address_id = azurerm_public_ip.pip_outbound.id
}

resource "azurerm_subnet_nat_gateway_association" "nat_vmss_subnet" {
  nat_gateway_id = azurerm_nat_gateway.nat_vmms_outbound.id
  subnet_id = azurerm_subnet.internal.id
}
Internal Load Balancer for inbound traffic
To route inbound (tcp based) traffic to the machine instances, we use an internal Azure Load Balancer (LNB) in Standard SKU. This is only required if the component - running in VMSS - offers an TCP based interface like for example an HTTP API.
# lnb.tf
resource "azurerm_lb" "lnb_int" {
  resource_group_name = var.rg_name
  location            = var.location
  name                = "lbint-vmss-sample"

  sku                 = "Standard"
  tags                = var.tags

  frontend_ip_configuration {
    name                          = "lbint-frontend-vmss-sample"
    public_ip_address_id          = null
    private_ip_address_allocation = "Dynamic"
    private_ip_address_version    = "IPv4"
    subnet_id                     = azurerm_subnet.internal.id
  }
}

resource "azurerm_lb_backend_address_pool" "be_pool" {
  name            = "be-vmss-sample"
  loadbalancer_id = azurerm_lb.lnb_int.id
}

resource "azurerm_lb_probe" "lnb_probe" {
  resource_group_name = var.rg_name
  loadbalancer_id     = azurerm_lb.lnb_int.id
  name                = "probe-vmss-sample"

  interval_in_seconds = 30
  number_of_probes    = 2
  port                = 8443
}
For demonstration purposes, let’s create a simple inbound rule to forward TCP traffic appearing on port 8443 to port 8443 of all machine instances.
# lnb-rule.tf
resource "azurerm_lb_rule" "lnb_rule" {
  resource_group_name            = var.rg_name
  loadbalancer_id                = azurerm_lb.lnb_int.id
  probe_id                       = azurerm_lb_probe.lnb_probe.id
  name                           = "rule-8443"

  backend_address_pool_id        = azurerm_lb_backend_address_pool.be_pool.id
  backend_port                   = 8443
  frontend_ip_configuration_name = "lbint-frontend-vmss-sample"
  frontend_port                  = 8443
  protocol                       = "Tcp"
}
Log Analytics Workspace🔗
With Terraform you can quickly provision a new instance of Log Analytics Workspace (LAW) using just a few lines:
# law.tf
resource "azurerm_log_analytics_workspace" "law" {
  resource_group_name = var.rg_name
  location            = var.location
  name                = "law-vmss-sample"

  sku                 = "PerGB2018"
}
The VMInsights solution for Log Analytics Workspace
VMInsights is a dedicated solution, that must be deployed into a LAW instance. In Terraform, we can quickly assign the solution to our LAW instance.
# vminsights.tf
resource "azurerm_log_analytics_solution" "vminsights" {
  resource_group_name   = var.rg_name
  location              = var.location
  solution_name         = "VMInsights"

  workspace_resource_id = azurerm_log_analytics_workspace.law.id
  workspace_name        = azurerm_log_analytics_workspace.law.name

  plan {
    product = "OMSGallery/VMInsights"
    publisher = "Microsoft"
  }
}
Virtual Machine Scale Set🔗
Azure VMSS allows fine-granular configuration to fit almost every need. For the sake of this article, I’ll use the default Windows VM images provided by Microsoft. Feel free to use your custom, tailored VM images at this point.
# vmss.tf
resource "azurerm_windows_virtual_machine_scale_set" "vmss" {
  resource_group_name  = var.rg_name
  location             = var.location
  name                 = "vmss-sample"

  admin_username         = var.vmss_admin_user
  admin_password         = var.vmss_admin_password
  computer_name_prefix   = "thns"
  instances              = var.vmss_instances
  license_type           = "Windows_Server"
  sku                    = var.vmss_sku

  provision_vm_agent     = true
  single_placement_group = true
  timezone               = var.vmss_timezone
  upgrade_mode           = "Automatic"

  identity {
    type         = "SystemAssigned"
  }

  source_image_reference {
    publisher = var.vmss_source_image_publisher
    offer     = var.vmss_source_image_offer
    sku       = var.vmss_source_image_sku
    version   = var.vmss_source_image_version
  }

  os_disk {
    storage_account_type = "Standard_LRS"
    caching              = "ReadWrite"
  }

  network_interface {
    name    = "nic_default"
    primary = true

    ip_configuration {
      name                                   = "ip_default"
      primary                                = true
      subnet_id                              = azurerm_subnet.internal.id
      load_balancer_backend_address_pool_ids = [azurerm_lb_backend_address_pool.be_pool.id]
    }
  }

  tags = var.tags

}
Although Terraform allows to inline VMSS extensions into the azurerm_windows_virtual_machine_scale_set resource, I decided to use dedicated azurerm_virtual_machine_scale_set_extension resources instead. Using dedicated resources for every extension will make code reviews easier, and the overall readability increases IMO.
The Log Analytics Agent extension
First, the Log Analytics Agent (MMA) extension must be deployed to the VMSS. I used Azure CLI (az) to spot the latest version available in my desired region:
# get latest MMA version available in westeurope
az vmss extension image list \
  -p Microsoft.EnterpriseCloud.Monitoring \
  -n MicrosoftMonitoringAgent \
  -l westeurope \
  --latest \
  -o jsonc

[
  {
    "name": "MicrosoftMonitoringAgent",
    "publisher": "Microsoft.EnterpriseCloud.Monitoring",
    "version": "1.0.18053.0"
  },
  {
    "name": "MicrosoftMonitoringAgent",
    "publisher": "Microsoft.EnterpriseCloud.Monitoring.Test",
    "version": "1.0.11049.1"
  }
]
At this point we know that MMA is available in version 1.0.18053.0 for virtual machines being provisioned in Azure Region westeurope. However, pinning the extension to the exact version did not work for me. It worked after specifying just major and minor version (1.0).
# vmss-ext-mma.tf
resource "azurerm_virtual_machine_scale_set_extension" "vmss_ext_mma" {
  virtual_machine_scale_set_id = azurerm_windows_virtual_machine_scale_set.vmss.id
  auto_upgrade_minor_version   = true
  name                         = "MicrosoftMonitoringAgent"
  publisher                    = "Microsoft.EnterpriseCloud.Monitoring"
  type                         = "MicrosoftMonitoringAgent"
  type_handler_version         = "1.0"

  protected_settings = jsonencode({
    "workspaceKey" = "${azurerm_log_analytics_workspace.law.primary_shared_key}"
  })

  settings = jsonencode({
    "workspaceId"               = "${azurerm_log_analytics_workspace.law.workspace_id}",
    "stopOnMultipleConnections" = true
  })
}
The Dependency Agent extension
Next, we need to add the Dependency Agent (DA) extension to the VMSS. Again we can consult az to identify the most recent version available in the desired Azure Region:
# get latest DA version available in westeurope
az vmss extension image list \
  -p Microsoft.Azure.Monitoring.DependencyAgent \
  -n DependencyAgentWindows \
  -l westeurope \
  --latest \
  -o jsonc

[
  {
    "name": "DependencyAgentWindows",
    "publisher": "Microsoft.Azure.Monitoring.DependencyAgent",
    "version": "9.10.10.16690"
  }
]
Again, specifying the exact version did not work here. Instead I used 9.10 as value for type_handler_version. On top that, we have to ensure that DA will be provisioned after MMA. Luckily, there is the provision_after_extensions property:
# vmss-ext-da.tf
resource "azurerm_virtual_machine_scale_set_extension" "vmss_ext_da" {
  virtual_machine_scale_set_id = azurerm_windows_virtual_machine_scale_set.vmss.id
  auto_upgrade_minor_version   = true
  name                         = "DependencyAgentWindows"
  publisher                    = "Microsoft.Azure.Monitoring.DependencyAgent"
  type                         = "DependencyAgentWindows"
  type_handler_version         = "9.10"
  provision_after_extensions = [azurerm_virtual_machine_scale_set_extension.vmss_ext_mma.name]

  settings = jsonencode({
    "enableAutomaticUpgrade" = true
  })
}
With both extensions in place, it’s time to move on, and provision the infrastructure.
Provisioning the infrastructure🔗
Having all necessary Terraform resources in place, it’s time to cycle through the terraform workflow once. The following script demonstrates all necessary commands:
# initialize a project
terraform init

# format all Terraform code
terraform fmt

# validate the project
terraform validate

# apply the project
terraform apply
Once deployment has finished, it takes 10 minutes until the first metrics and logs appear in VMInsights. You can browse VMInsights in Azure Portal either by navigating to Azure Monitor -> Insights -> Virtual Machines, or by opening the Insights blade within your newly provisioned instance of VMSS.
At this point, VMInsights will present some pre-configured metric-based charts, as shown in the following picture.
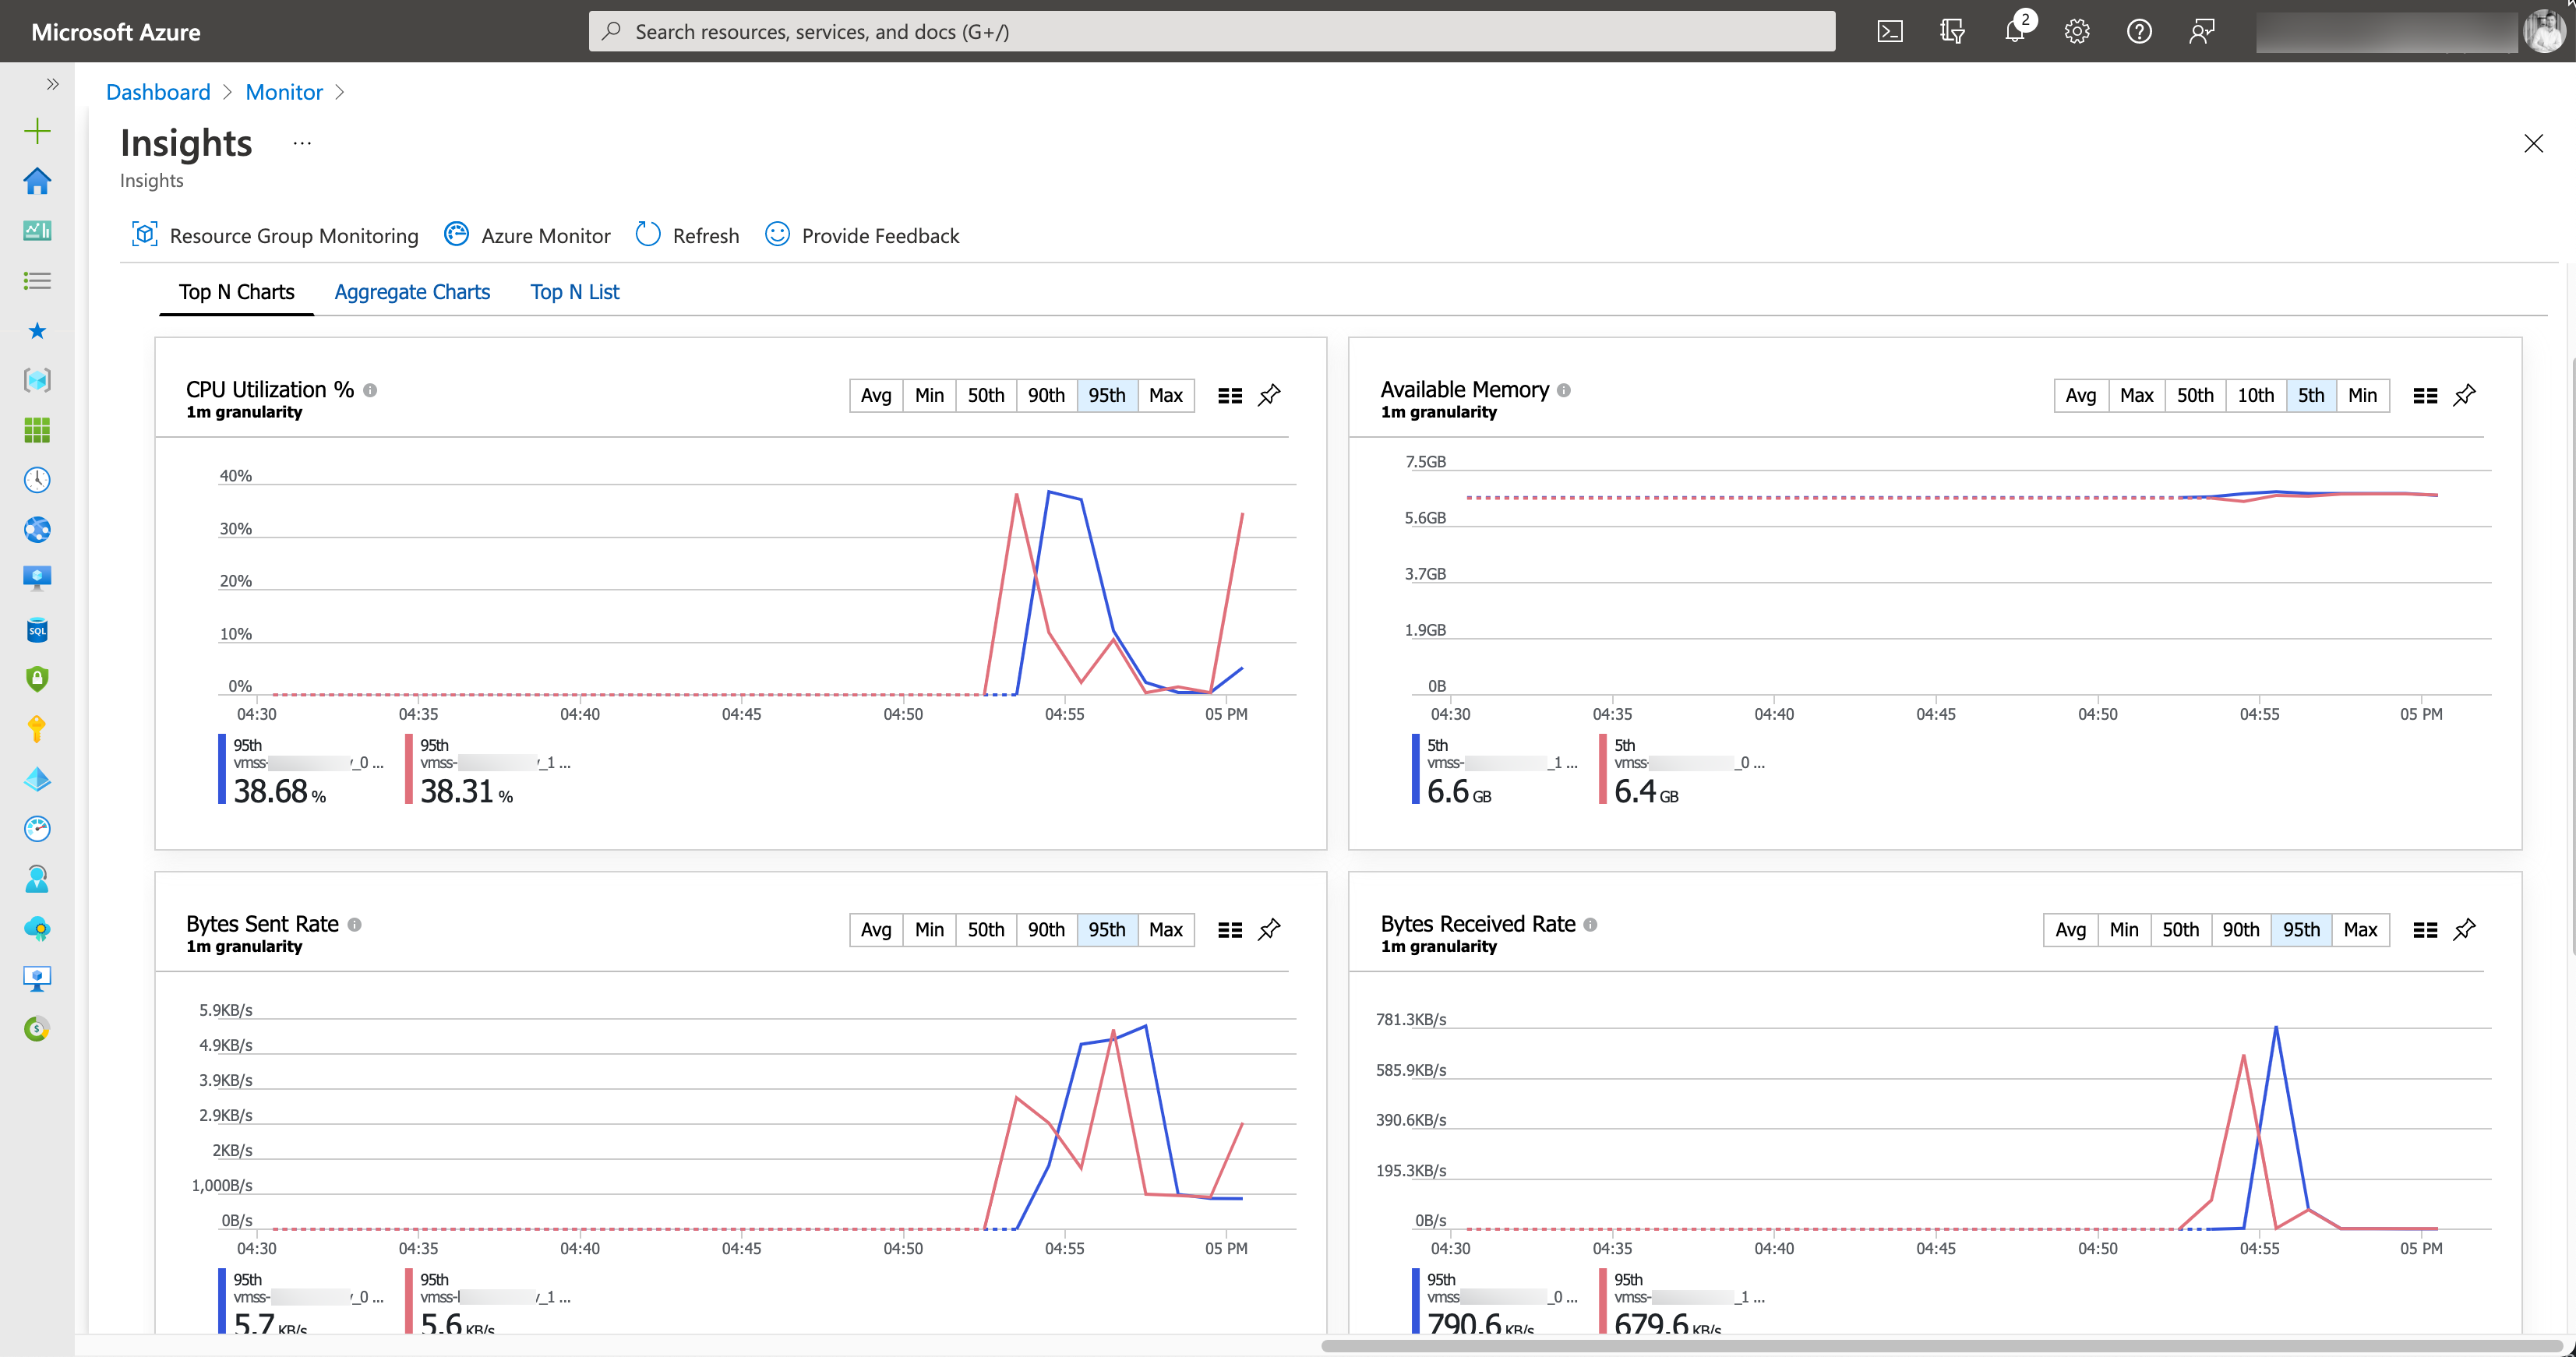
VMInsights - Detailed guest metrics in Azure Monitor
You can also use KQL do dive even deeper in metrics and logs being collected from the underlying virtual machines. The official documentation provides some great queries that you can use a starting point.
Conclusion🔗
By configuring a deep integration with Azure Monitor and Log Analytics Workspace, you can take action on actual (almost real-time) metrics exposed from your cloud workload. As we see more and more organizations adopting Azure, transparency, monitoring, and fast feedback cycles become more important. Gathering Metrics and building custom monitoring and alerting solutions is essential. Having a rich set of metrics in Log Analytics Workspace, you can move on and configure an even deeper integration of Virtual Machine Scale Sets with Azure Monitor. For example, you can create a tailored scaling experience using Azure Monitor AutoScaling and configure scale-out and scale-in according to your needs.
The entire sample is available in this GitHub repository.